linkedin
  • Become a Seller

Get Free Advice

Show Price

Spider IRIS logo
Gallery Spider Software Tutorial | How To Use Spider Stock Market Software ( In Hindi )
Spider IRIS Spider IRIS Spider IRIS Spider IRIS Spider IRIS
play Spider Software Tutorial | How To Use Spider Stock Market Software ( In Hindi )
Spider IRIS
Spider IRIS
Spider IRIS
Spider IRIS

Spider IRIS

Brand : Spider Software

ts_icon_wide
Starting Price:

₹ 55,000 excl. GST

₹ 64,900 incl. GST

View plans

Save Extra with 2 Offers

  • offer_icon Save upto 28%, Get GST Invoice on your business purchase |
  • offer_icon Buy Now & Pay Later, Check offer on payment page.

Spider IRIS is one of the best solutions available in the market for doing technical analysis of the Indian stock market trading indices. It has a salient feature, which tracks the changes as well as developments in the market and alerts a user to make use of the best available opportunity in the m...Read more

  • AdviceGet Instant Expert
    Advice
  • PaymentSafe & Secure
    Payment
  • GuaranteedAssured Best Price
    Guaranteed

Spider IRIS Software Pricing, Features & Reviews

What is Spider IRIS?

Spider IRIS is one of the best solutions available in the market for doing technical analysis of the Indian stock market trading indices. It has a salient feature, which tracks the changes as well as developments in the market and alerts a user to make use of the best available opportunity in the market. Spider IRIS supports different types of charts and graphs to help end-users understand the wider market trends.

The stock market analysis solution further repsoroduces all the technical observation in the form of a trend line that is further vital for both identification and confirmation. This feature automatically draws the trend lines on the chart.

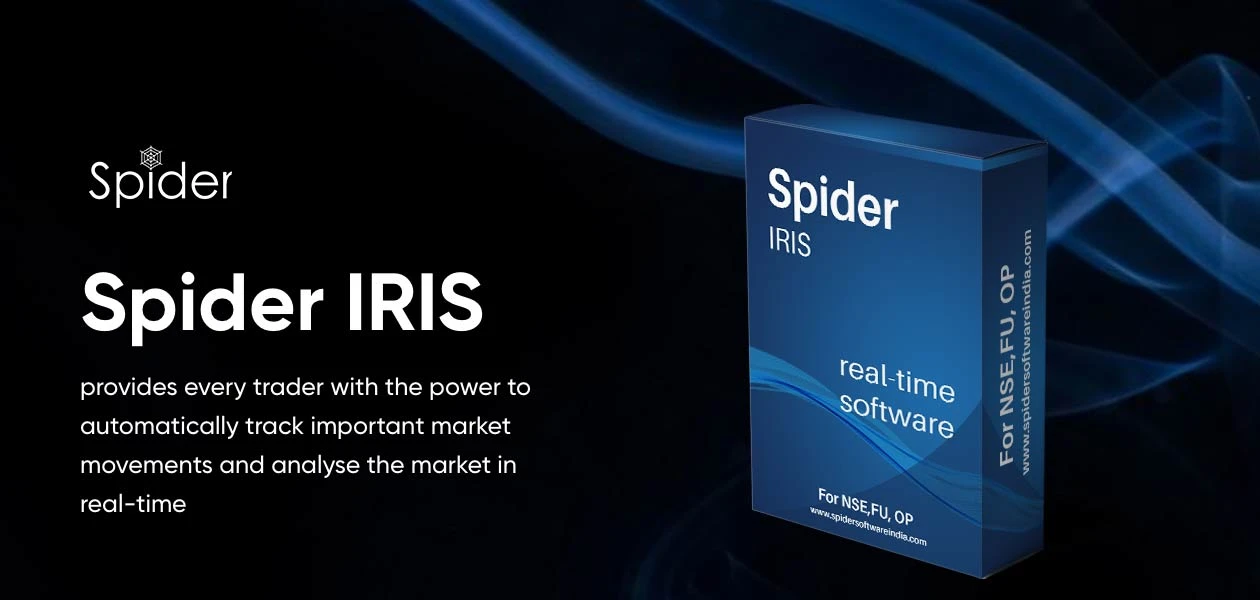
Spider IRIS provides every trader with live market data from the internet. The real-time stock market software provides highly advanced charting and comprehensive stock index analysis tools. Further, the software tracks the decisive market movement and analyzes them in real-time.

What are the benefits of using Spider IRIS software?

Here are some key benefits of using Spider IRIS stock market software:

  1. Spider IRIS is a pocket-friendly stock market solution out there.
  2. The software has a query function that allows users to check through any claim instantly.
  3. Zero coding requirement for data accessibility.
  4. The software is rife with shortcuts as almost every function or feature is accessible through the keyboard.
  5. The software offers detailed information regarding multiple aspects like bulk orders, open interests, volume, and other price action related information.
  6. Spider IRIS offers a handy guide for newcomers to enter the investment game.

What are the features offered by Spider IRIS stock market software?

Here are some common features offered by Spider IRIS:

  1. Automated trend line
  2. Gann Square of 9
  3. Derivative summary report
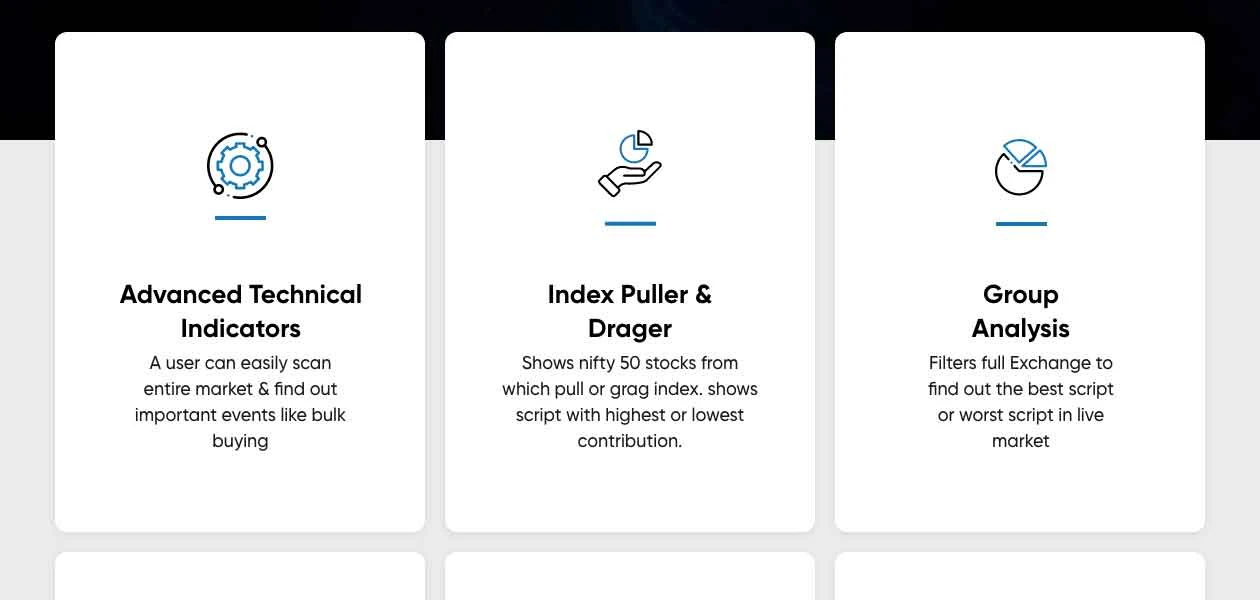
  4. Group analysis
  5. Candlestick scanner
  6. Delivery volume report
  7. Price based chart types

What is the Spider IRIS price?

The price of Spider IRIS is Rs. 50622. For more, please request a call at TechJockey.

Product Enrichment Section Image Product Enrichment Section Image Product Enrichment Section Image Product Enrichment Section Image

Spider IRIS Pricing & Plans

Spider IRIS
  • Portfolio Management
  • Performance Analytics
  • Market Data
  • Price Alert
  • Intraday Trading
  • Derivative Trading
  • Industry Analysis
  • Portfolio Tracking
  • Charting Tools
    • Quantity
    • Yearly (Years)

Calculated Price (Exclusive of all taxes)

₹ 55000
Daily Comparative Charts

Daily Comparative Charts

Compare Daily chart and Intraday with other or with group, which help you to find out in outperform scripts and perform.

Group Analysis

Group Analysis

Group analysis is a procedure to filter full Exchange to find out the top most script or worst script in live market. Group Analysis is a wonderfully intended function which allow you the best result of Gainer or looser groups.

STRATEGY TESTING

STRATEGY TESTING

Back testing is the procedure of testing a trading strategy on applicable historical data to ensure its viability earlier the trader risks any authentic capital.
MARKET SUMMARY

MARKET SUMMARY

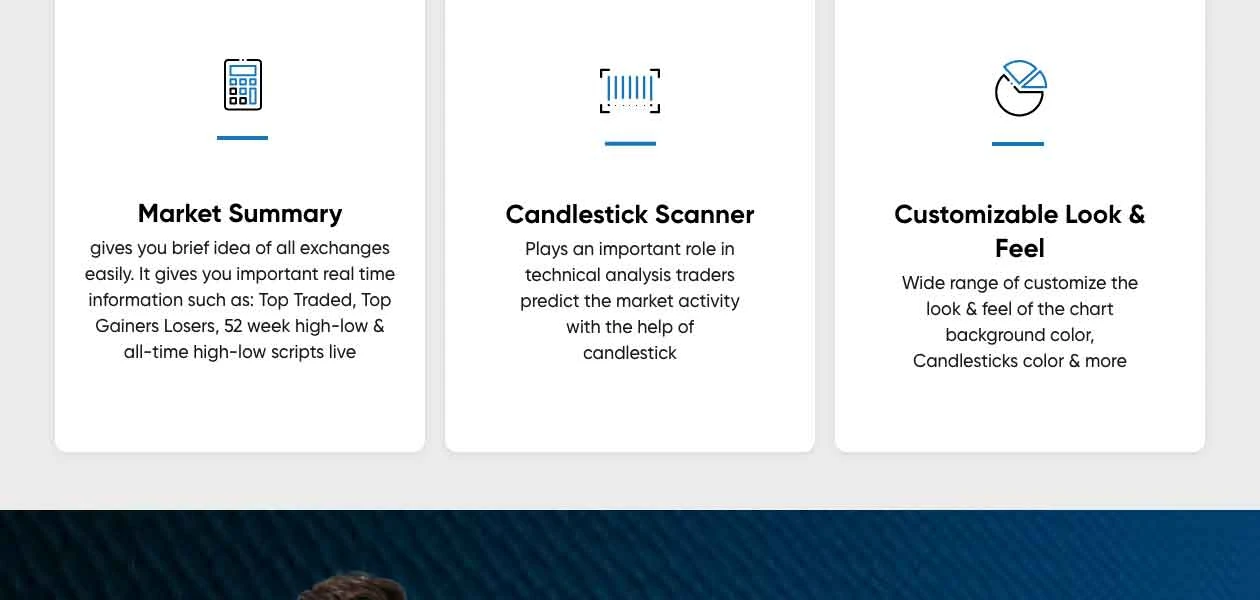
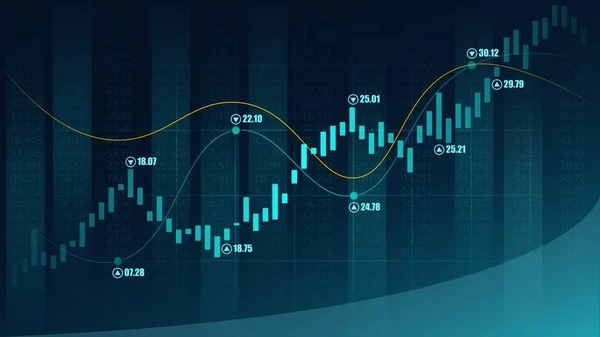
Market summary will give you brief idea of all exchanges with ease. It gives you important real time data such as: Top Gainers Losers, Top Traded, 52 week high and low and all-time high and low scripts live.

Get Spider IRIS Demo

We make it happen! Get your hands on the best solution based on your needs.

Interacted

Spider IRIS Features

Core Features

  • icon_check Portfolio Management Track and analyze investment holdings, returns, and asset allocation in real time.
  • icon_check Market Data Real-time and historical stock price feeds, trade volume, and market indices for analysis.
  • icon_check Charting Tools Visual tools for analyzing stock trends and patterns using technical indicators and price movements.
  • icon_check Stock Screener Filters stocks based on specific criteria like market cap, P/E ratio, or price movement.
  • icon_check Order Control Tools to manage, modify, and cancel buy or sell orders efficiently on the trading platform.
  • icon_check Order Execution Automated system to process buy/sell orders directly via the broker and stock exchange.
  • icon_check Watchlist A customizable list for monitoring preferred stocks, providing real-time updates on price and volume.

Order Execution

  • icon_check Limit Order An order to buy/sell at a specific price or better, ensuring price control but not guaranteed execution.
  • icon_check Market Order Buy/sell immediately at the current market price, ensuring execution but no price control.
  • icon_check Trailing Stop Order Automatically adjusts stop price as the market price moves in favor of the position.
  • icon_check Stop (Loss) Order Automatically sells stock when it drops to a pre-set price to minimize losses.
  • icon_check Stop Limit Orders Combines a stop-loss order with a limit order to sell/buy once a set price is triggered.

Research and Analysis

  • icon_check Analyst Ratings Displays professional analyst opinions on stocks, including buy, hold, or sell recommendations.
  • icon_check Advanced Order Flow Analysis Tracks and analyzes buying and selling activity across the market.
  • icon_check Multi-Timeframe Analysis Analyzes price trends across different timeframes for better decision-making.
  • icon_check Sentiment Analysis Evaluates market sentiment from news and social media to gauge stock trends.

Technical Analysis

  • icon_check Trendlines Visual representation of stock price trends over time to predict future movements.
  • icon_check Technical Indicators Tools like RSI and MACD for analyzing stock price momentum and direction.
  • icon_check Custom Indicators Create and apply personalized technical indicators for unique trading strategies.
  • icon_check Smart drawing tools Customizable tools to draw patterns like support, resistance, and Fibonacci retracements.
  • icon_check Automated Technical Patterns Detection Automatically identifies patterns like head and shoulders or flags.

Fundamental Analysis

  • icon_check Industry Analysis Compares stock performance against industry benchmarks for relative valuation.
  • icon_check Financial Ratios Key metrics like P/E and P/B ratios to evaluate stock value relative to financial performance.
  • icon_check Cash Flow Statements Tracks cash inflows and outflows to assess company liquidity and operational efficiency.
  • icon_check Income Statement Displays a company’s revenue, expenses, and profitability over a specific period.
  • icon_check Balance Sheet Shows a company's assets, liabilities, and shareholders’ equity for financial health analysis.
  • icon_check Earnings Forecasts Predicts future earnings based on historical data and market conditions.
  • icon_check Company Valuation Models Estimates a company’s value based on DCF, NPV, and other valuation methods.

Backtesting and Optimization

  • icon_check Historical Data Simulation Tests trading strategies against past data to assess their effectiveness.
  • icon_check Strategy Tester Evaluates the performance of trading strategies before deploying them in live markets.
  • icon_check Paper Trading Practice trading without risking real capital using simulated environments.
  • icon_check Strategy Optimization Fine-tunes trading strategies by adjusting parameters for improved performance.
  • icon_check Monte Carlo Simulation Uses probabilistic models to forecast trading outcomes in uncertain conditions.

Risk Management

  • icon_check Performance Analytics Tracks portfolio and trade performance through returns, drawdowns, and risk measures.
  • icon_check Risk Calculator Estimates potential profit/loss scenarios based on trade size and risk percentage.
  • icon_check Position Sizing Calculator Determines the appropriate trade size based on risk tolerance and market conditions.
  • icon_check Diversification Analysis Analyzes portfolio risk by evaluating asset allocation and exposure to different sectors.
  • icon_check Stop-Loss Automation Automatically implements stop-loss rules to limit potential trading losses.
  • icon_check Maximum Drawdown Analysis Measures the largest peak-to-trough decline in a portfolio's value.

Trading Options

  • icon_check Intraday Trading Buy and sell stocks within the same trading day to capitalize on short-term movements.
  • icon_check Derivative Trading Trade derivatives like options, futures, and swaps based on underlying assets.
  • icon_check Options Trading Allows the buying/selling of call and put options for speculative or hedging purposes.
  • icon_check Automatic Trading Uses automated systems to execute trades according to predefined criteria.
  • icon_check Paper Trading Practice trading without risking real capital using simulated environments.
  • icon_check Algorithm Trading Executes trades based on pre-set algorithms without manual intervention.
  • icon_check Futures Trading Trade contracts to buy or sell assets at a future date at predetermined prices.
  • icon_check Forex Trading Enables trading in currency pairs based on fluctuations in the foreign exchange market.
  • icon_check Crypto Trading Buy/sell cryptocurrencies like Bitcoin and Ethereum on dedicated platforms.
  • icon_check Rotational Trading Alternates investments between sectors, asset classes, or strategies based on market trends.
  • icon_check Spread Trading Speculative trading of the price difference between two assets.
  • icon_check Swing Trading A strategy that captures shortto medium-term gains from price swings.

Reporting & Analytics

  • icon_check Dashboards Visual displays of key metrics like portfolio performance, risk levels, and trade history.
  • icon_check Portfolio Tracking Real-time tracking of your investments, including value, returns, and allocations.
  • icon_check Customizable Reports Tailored reports to analyze performance, tax implications, or investment behavior.
  • icon_check Risk Analytics Analyzes portfolio risks by measuring volatility, drawdowns, and exposure.
  • icon_check Trade Performance Attribution Breaks down the source of trading gains or losses for better analysis.

Account Management

  • icon_check Multi-Factor Authentication (MFA) Adds a second layer of security to protect accounts from unauthorized access.
  • icon_check Customizable User Interface Allows users to personalize the layout and appearance of the platform.
  • icon_check Account Summary Reports Provides detailed summaries of account balances, holdings, and transactions.
  • icon_check User Access Management Controls who can execute trades, view reports, or manage funds based on assigned privileges.
  • icon_check Audit Trail Tracks and logs user activity to maintain compliance and security.

Integrations

  • icon_check Market Data Integration Links the platform to real-time market data feeds for timely trading decisions.
  • icon_check Brokerage Integration Connects to brokerage accounts for seamless trading and order execution.
  • icon_check Third Party Integration Supports tools like research platforms, analytics software, and financial news services.
  • icon_check Social Media Integration Connects with social platforms to track sentiment, discussions, and trends.
  • icon_check Multi-Language Support Provides the ability to use the software in various languages for global accessibility.
  • icon_check API Integration Connects with external APIs for custom trading, data feeds, or system automation.
  • icon_check Cloud Data Integration Stores and accesses trading data through cloud services for scalability.

Alerts & Notifications

  • icon_check Price Alert Notifies users when stock prices reach a specific target or threshold.
  • icon_check Real-Time Market Updates Sends alerts on price changes, market movements, and breaking news.
  • icon_check News Alert Delivers important financial news related to specific stocks or sectors.
  • icon_check Volume Alerts Signals abnormal trading volume, indicating potential market movements.
  • icon_check Push Notifications Sends updates directly to mobile devices for timely decisions.
  • icon_check Sentiment Alerts Notifies users of changes in market sentiment based on social or news analysis.

Spider IRIS Specifications

  • Supported Platforms :
  • Device:
  • Deployment :
  • Suitable For :
  • Business Specific:
  • Business Size:
  • Customer Support:
  • Training:
  • Language:
  • Integration Supported:
  • Windows MacOS
  • DesktopMobile
  • Perpetual
  • Finance , Stock Market
  • Traders, Stock Market
  • Small Business, Startups, Medium Business, Enterprises, SMBs, SMEs, MSMBs, MSMEs
  • Phone, Email, Communities
  • Documentation, Videos
  • English

Spider IRIS Reviews and Ratings

banner

Would you like to review this product?

Submit Reviews

Spider Software Company Details

Brand Name Spider Software
Information Spider Software Pvt. Ltd. is the foremost developer of Real-Time and End of Day (EOD) Technical Analysis software, curated exclusively for the stock market traders of India.
Founded Year 2000
Director/Founders Devesh Negandhi
Company Size 101-500 Employees
Other Products Spider IRIS Plus, Spider CTCL (For Broker Only), Spider IRIS EOD, Spider ACE, Spider ACE PRO

Spider IRIS FAQ

A Yes, you can get the demo scheduled for Spider IRIS before purchase. Please send us a call request for the demo.
A
System requirements for Spider IRIS stock market software are as follows:

1. OS: Windows 7 or higher

2. Processor: 2 GHz or faster

3. RAM: 2 GB

4. Hard Disk Space: 1000 MB minimum
A No, Spider IRIS does not require any update at all. You only need to install it once and use it forever.
A No, there are no extra charges for setting up of Spider IRIS.
A No, Spider IRIS is not available for smartphones as of now.

Spider IRIS Alternatives

See All
Why Choose Techjockey?

Software icon representing 20,000+ Software Listed 20,000+ Software Listed

Price tag icon for best price guarantee Best Price Guaranteed

Expert consultation icon Free Expert Consultation

Happy customer icon representing 2 million+ customers 2M+ Happy Customers