linkedin
  • Become a Seller

Best Debugging Software in 2024

What is Debugging Software?

Debugging software is a tool that helps in identifying, analyzing, and resolving errors, bugs, or issues within computer programs. It ensures that the application runs smoothly and as intended. They help identify coding errors at various stages of the software development process. Read Buyer’s Guideimg

Best Debugging Software

(Showing 1 - 10 of 21 products)

Most PopularNewest FirstTop Rated Products
Memfault

Memfault

Brand: Memfault

4.4img

4.4 out of 5

(0 user reviews)

With Memfault, you can track device metrics, analyse crash reports, and receive alerts for potential problems. Its user-friendly interface and powerful ana... Read More About Memfault read review arrow

$1,500

Backtrace

Backtrace

Brand: Backtrace

4.5img

4.5 out of 5

(0 user reviews)

Backtrace is a debugging platform that provides comprehensive crash and error reporting, enabling developers to quickly identify and resolve software issue... Read More About Backtrace read review arrow

$600

Lumigo

Lumigo

Brand: Lumigo

4.4img

4.4 out of 5

(0 user reviews)

Using Lumigo, you can gain deep visibility into your applications' performance and behaviour, identify and resolve issues quickly, and ensure the reliabili... Read More About Lumigo read review arrow

$99

Fiddler

Fiddler

Brand: Progress Software Corporation

4.5img

4.5 out of 5

(0 user reviews)

Fiddler is a powerful web debugging proxy that helps monitor, analyse, and modify HTTP traffic, streamlining the debugging process and providing valuable i... Read More About Fiddler read review arrow

$12

Bugsee

Bugsee

Brand: Bugsee

4.3img

4.3 out of 5

(0 user reviews)

Bugsee is a bug and crash reporting tool for iOS and Android apps that captures video, logs, and network data.... Read More About Bugsee read review arrow

$139 /Month

Debugging Software Product List Top Banner - 1
Debugging Software Product List Top Banner - 2
Instabug

Instabug

Brand: Instabug

4.5img

4.5 out of 5

(0 user reviews)

Instabug is a mobile app debugging and performance-enhancing tool that provides features for testing, monitoring, and improving user experience.... Read More About Instabug read review arrow

$299 /Month

TotalView

TotalView

Brand: Perforce

Be the first to review

With TotalView, you can quickly identify and resolve issues, improve performance, and ensure the stability of your applications. TotalView is trusted by le... Read More About TotalView read review arrow

Price On Request

Rogue Wave Totalview

Rogue Wave Totalview

Brand: rogue-wave

Be the first to review

Rogue Wave TotalView is the best debugging software, Faster fault isolation, improved memory optimization, and dynamic visualization for your high performa... Read More About Rogue Wave Totalview img

Price On Request

SonarCloud

SonarCloud

Brand: SonarSource

Be the first to review

... Read More About SonarCloud img

Price On Request

NerdVision

NerdVision

Brand: NerdVision

Be the first to review

NerdVision is a software tool designed to simplify debugging and troubleshooting in software development, offering real-time insights into code execution a... Read More About NerdVision read review arrow

Price On Request

Last Updated on : 21 Nov, 2024

ask your question about software

Got any questions?

Ask Question from Real Users
or Software Experts

img
img

We provide the best software solution for your business needs

Founded in 2016, Techjockey is an online marketplace for IT Solutions. We are a pioneer in this field, as we are taking IT solutions to SMBs & MSMEs in tier II & tier III cities and enabling digitization of day-to-day processes.

2 Million+

Happy Customers

500+

Categories

20,000+

Software listed

Best Debugging Software FAQ’s

Software questions,
answered

Some of the most common types of debuggers are static debugger and dynamic debugger. Dynamic debuggers can be further classified as breakpoint debugger, meta debugger, kernel debugger, etc.

When any software does not perform as per the expectation, programmers and developers need to determine the cause of errors. Debugging tools will help them run the software program under a controlled environment, analyze codes in a stepwise manner, and fix issues, if any.

  Debugging tools are essential for software development because they help developers to find and fix errors in their code. Without debugging tools, it can be very difficult to track down the root cause of an error, especially in complex codebases.

Some of the most popular debugging tools for Windows are Nemiver, Valgrind, GNU Debugger, ReSharper, Fiddler, etc.

class Pdb is the name for python debugger which is easy to understand just by simply reading the code source.

Some of the available domains for Chrome debugger includes Audits, CSS, Database, Profiler, Log, DOM, Target, Console, Fetch, IO, and more.

Articles for Debugging Software

Debugging Software Price List In India

Debugging Software Cost
Top Debugging Software Starting Price Rating
Memfault$1500.00 4.4
Backtrace$600.00 4.5
Lumigo$99.00 4.4
Fiddler$12.00 4.5
Bugsee$139.00 /Month4.3
Instabug$299.00 /Month4.5

Buyer's Guide for Top Debugging Software

Found our list of Debugging Software helpful? We’re here to help you make the right choice and automate your business processes. Let’s discover some of the essential factors that you must consider to make a smarter decision!

  • What Is Debugging Software?
  • What Does Debugging Tools Do?
  • Why Is Debugging Important & How Debugging Tools Help?
  • Benefits of Debugging Software
  • How Does Debugging Work?
  • What’s the Difference between Debugging and Testing?
  • Coding Errors That Require Debugging
  • Common Debugger Features/ Debugging Strategies in Software Engineering
  • How Much Does Debugging Software Cost?
  • Popular Types of Debugging Tools
  • How to Find the Best Debugging Software

What Is Debugging Software?

Debugging software, also known as debuggers, is used by programmers and developers to find bugs in the code of any software or application. Debugging tools test and analyze the current state of any software/application and suggest ways to fix issues, if any.

What Does Debugging Tools Do?

Debugging tools are used by computer programmers to discover issues with any software or application. When an application is not functioning properly, debugging software analyses its code to determine errors. Online debugger runs the application in a controlled environment and analyses its code in a stepwise manner to detect and fix issues.

Why Is Debugging Important & How Debugging Tools Help?

Software and apps have several layers of abstraction and there are several components coordinating with each other for their smooth functioning. Debugging is important as it helps determine if any given software, application or operating system is behaving properly or not. Even when programmers are using the ideal coding standards, a new program is quite likely to have bugs.

In case of any error, programmers often find it difficult to find and resolve issues manually. However, online debuggers help them fix problems faster and ensure uninterrupted usage of software and applications. Debugging in software engineering with the help of debugging tools ensures better software quality and improved end-user experience.

Benefits of Debugging Software

Debugging software helps developers and programmers detect software or application bugs at the right time. It ensures better utilization of time and resources during the software development cycle to deliver optimum software quality. All these result in higher satisfaction among the end users.

  • Improves Software/Application Quality: It identifies and fixes errors in software programs and ensures lesser bugs in their future versions. With timely bug resolution, the program’s quality gets better.
  • Increases End User Satisfaction: Debugging ensures proper function of any software program, as intended by developers and programmers and as desired by the end users.
  • Ensures Better Time & Resource Management: It detects bugs at the right time, before it’s too late to fix errors. Consequently, it saves the time and resources required during software development lifecycle.

How Does Debugging Work?

The debugging process is usually performed in three different stages: error identification, error analysis, and fixing and validation.

  • Problem identification: At this stage of software debugging, the bugs are reported by testers, developers and end users. Then, the developers analyze every line of code to identify the cause of bugs or errors. This is often a time-consuming process that requires a lot of focus. Also, a report is created on the problems experienced by the end users.
  • Error analysis: Defect analysis is performed using different methods like documentation, modeling, detecting and testing of candidate flaws. Coders have to analyze program changes and prioritize bug fixing as per their role in ensuring uninterrupted software functionality. They also define the timeline for different bug fixes as per the set priority.
  • Bug Resolution and Validation: Once the bugs have been identified, the next step is to resolve the bugs and run tests to validate corrections. Developers may have to write completely new tests in case the bugs reappear in the future.

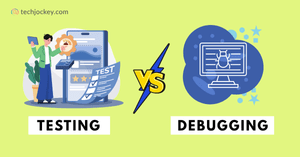
What’s the Difference between Debugging and Testing?

Testing and debugging often happen simultaneously to ensure that a software program runs smoothly. While testing analyses the impact of an error in the source code on the functioning of the software program. Debugging is majorly about identifying the mistakes in a program’s source code and fixing them. Debugging helps identify the cause of errors, while testing evaluates the impact of errors.

Testing Debugging
Display’s errors It’s a deductive process
Performed by testers Performed by developers/programmers
Finds bugs Rectifies the bugs
Design knowledge is not required Proper design knowledge is necessary
Based on testing levels Based on bug types
Testing happens right after the code is written Starts after the test case’s execution
It’s a part of software development lifecycle It happens as a testing consequence

Coding Errors That Require Debugging

Some of the common coding errors that require quick debugging are syntax errors, Symantec errors, runtime errors, and logic errors.

  • Runtime errors: Such errors occur primarily because of the computing environment in which the software runs. The computing environment can have issues like stack overflow or limited memory space.
  • Logic errors: These types of errors are often made by programmers who represent the algorithm of a software program incorrectly. To identify errors like the incorrect if-then outcome, you need to go through the code in a stepwise manner for different input and output scenarios.
  • Syntax errors: Syntax errors are more like spelling errors or typos in word processing, and a computer program just won’t run with any syntax error.
  • Symantec errors: These errors occur when programming statements are not used properly.

Common Debugger Features/ Debugging Strategies in Software Engineering

  • Unit Testing to test individual components of a computer program to detect bugs and errors.
  • Code inspection is based on manual review of the source code of any software or application to identify errors.
  • Monitoring is basically observing any software for unusual issues that signify bugs.
  • Logging is monitoring a software system and recording its events for bugs, if any.
  • System testing involves testing the entire computer program for issues and unusual behavior.
  • Integration testing monitors the interactions between different software components and identifies bugs.
  • Remote debugging involves the monitoring of remote software systems running in a separate computing environment away from your local machine.
  • Cloud debugging is performed by emulating cloud-based architectures on your local machines.
  • Backtracking is majorly done for smaller programs where developers track backwards for any error in the code.

How Much Does Debugging Software Cost?

For error detection and performance detection to a certain limit, you can also rely on free debugging software. Most debugging tools offer the free starter package and as your debugging tasks scale, you can move to their paid plans. You can get debugging start at the price as low as $0.99/month. On average, the price of debugging software ranges from $0.99 to $30 per month.

Here’re some of the best debugging software with their pricing and features.

Software Key Features Pricing
Rogue Wave Totalview Data visualization, Reverse debugging, Advanced memory debugging $4,402.99
BlackBox AI Automated coding suggestions, You can choose relevant code, Supports 20+ programming languages $0.99/month
Visual Studio Code Built-in GIT, IntelliSense, Run and debug $45/month
SonarCloud Multiple instances of DevOps platform, Taint analysis, Branch analysis $150 per year
Rollbar Production code quality, Low risk releases, Effective testing & QA $12.50 /month

Popular Types of Debugging Tools

Before selecting any debugging tool, you must know about the different types of debugging tools and how they function. Static debugging tools scan your computer program or operating system for the source code and highlight potential errors and vulnerabilities. Static analytic tools don’t analyze the code while the program is running, which helps in improving code quality. On the contrary, dynamic debugging tools monitor your software and operating system while it’s running to diagnose vulnerabilities.

How to Find the Best Debugging Software

You need to consider factors like the type of debugging tools your need, features and functionalities, and the ease of use.

  • Availability of Major Features: Look for features like cross-platform compatibility, remote debugging, multithread debugging, graphical user interface and command line interface.
  • Ease of Use: Check if the software you are selecting is easy to learn and use. The availability of demos and tutorials will help in comparing different debugging software options efficiently.
  • Debugging Software Types: While static debugging tools scan your software program without running the code, dynamic tools run the code to identify issues. If you also want to improve code quality along with detecting code errors, then static debugging tools are for you.

Still got Questions on your mind?

Get answered by real users or software experts

20,000+ Software Listed 20,000+ Software Listed

Best Price Guaranteed Best Price Guaranteed

Free Expert Consultation Free Expert Consultation

2M+ Happy Customers 2M+ Happy Customers