12 Most Accurate Intraday Trading Indicators for Option and Equity Trading


Summary: Whether you are a beginner or an established trader, it is extremely important to adhere to the basic intraday trading indicators to ensure high profits. You can set a strong foot in the trading world with this in-depth guide and rediscover the hidden stock trading champ in you.
Someone rightly said that there can’t be anything more volatile than the stock market. I truly believe that the stock market is incredibly unpredictable, just as someone wisely pointed out. It’s a roller-coaster where you can never be certain if it’s going to rise or fall.
However, with the best indicator for intraday option trading, you can hope to achieve some semblance, minimize losses and maximize profits.
And guess what? After years of trial and error, I’ve finally discovered the 12 most reliable indicators that have consistently guided me towards profitable trades.
What are the Best Intraday Strategy for Beginners?
Who doesn’t like the prospect of earning large amounts of money and that too in a short time? Such an ambition is what makes a trader, but high degrees of such ambition can result in a catch 22 situation.
Beginners, riding on the back of adventurism, tend to pump in more funds in a single buying-selling cycle and risk losing the entirety of it. We took note of more such reckless trading behaviors and have come up with the best intraday trading strategies.
- Research is everything: Have an extensive knowledge of events across the world that can impact the market. Especially scan through financial sections in newspapers and business magazines.
- Assess your risk absorption: Evaluate how much funds you have to trade and then keep aside a portion of it you can risk losing while trading on an everyday basis. Most experienced traders keep this to 1-2% of their funds.
- Invest time, not just money: As a beginner, it would be tough for you to spot the right trading opportunities. This is why you need to learn the game the hard way and invest a large amount of time acclimating yourself to the tricks.
- Baby steps… at least in the beginning: Walk when you can’t run. No need to go all gun blazing in the initial few months of stock trading. Concentrate on less than three stocks at a time. This will also allow you to easily spot buy-sell opportunities.
- Say no to penny stocks: Penny stocks might look like the right place to begin as a beginner but it’s not the case. These stocks are illiquid and do not offer any real chance to punch above your initial investment.
List of 12 Best Technical Indicators for Intraday Trading in 2024
- Bollinger Bands: Lagging Indicator that provides the overbought and oversold conditions of the market with price and volatility.
- Relative Strength Index: One of the Best indicator for option trading that determines the position of the market based on gain and loss for a period
- Moving Average Convergence Divergence (MACD): Relative indicator plotted with a slow MA and fast MA that gives entry and exit points. It is the best indicator for option trading in Zerodha.
- Advance Decline Line: A breadth indicator determined by the net advances of an Index to track the market sentiment.
- Moving Averages: General price-trend indicator based on the average historic price movement of a particular stock.
- Average Directional Index: Lagging indicator based on RSI helps in confirming the direction of the trend.
- Supertrend: Trend following indicator that helps to determine the entry and exit point.
- Stochastic Oscillator: Lagging indicator that provides overbought and oversold conditions in case of a choppy or sideways market.
- Commodity Channel Index: Indicates the divergence from normal trend by using deviation of stock’s moving average price.
- On Balance Volume: An important stock indicator that predicts trends based on both price movement and volume changes.
- Accumulation/Distribution Line (A/D Line): Indicates the accumulation and distibution of stock based on price and volume changes.
- Aroon Oscillator: Lagging Indicator that indicates the strength of a trend and predicts it ability to continue.
Interested in trading in stocks but do not know where to begin?
We have researched over 100 accurate intraday indicators and shortlisted only the best indicator for bank nifty intraday trading that will surely increase your profits.
Bollinger Bands

Bollinger bands can be visualized as price envelopes that are developed along the standard deviation up and down an average price. This technical analysis for intraday trading uses parameters such as period and StdDev. 20 is the preset value for each period and 2 for standard deviations but these can be changed as per your need.
How Does Bollinger Bands Indicator for Bank Nifty Intraday Work?
When the bands are close enough, it denotes a period of low volatility where the price can turn sharply either way. When there is a gap between the bands, then it denotes a period of high volatility and most possibly of any ongoing trend coming to an end.
The price of stocks keeps bouncing between the upper and lower envelope. If the price bounced off from the lower envelope, crossed the average and now moves towards the upper envelope, then it can be set as the profit target and vice versa.
Bollinger Bands: Key Takeaways
- Know if a stock is overpriced or underpriced
- Helpful in determining the entry and exit points
- Useful in all types of trade: Intraday, swing, long term, options, etc.
- Doesn’t confirm the trend or strength of the trade
Relative Strength Index

The relative strength index is one of the best indicators for intraday for getting a useful trading view. This indicator has 0 and 100 as its minimum and maximum value set points with an overbought condition declared when the indicator moves above 70. In the same sense, there is an oversold condition the indicator moves below 30.
Relative Strength Index: How Do the Best Indicators for Option Trading Work?
The indicator’s overbought and oversold levels are adjustable as per your need. In a bear market, the RSI generally remains in the range of 10-60 with values between 50-60 considered as resistance.
Conversely in a bull market, the RSI tends to stay between 40-90 with values between 40-50 considered as support.
RSI Indicator: Key Takeaways
- Used to check position of a particular stock in the market
- Potential Buy Signal: RSI below 30 (oversold)
- Potential Sell Signal: RSI above 70 (over brought)
- Gives false signals in case of sharp rise or fall of price
- Best results when combined with other signals
Suggested Read: Top Nifty Buy Sell Signal Software for Indian Stock Market
Moving Average Convergence Divergence
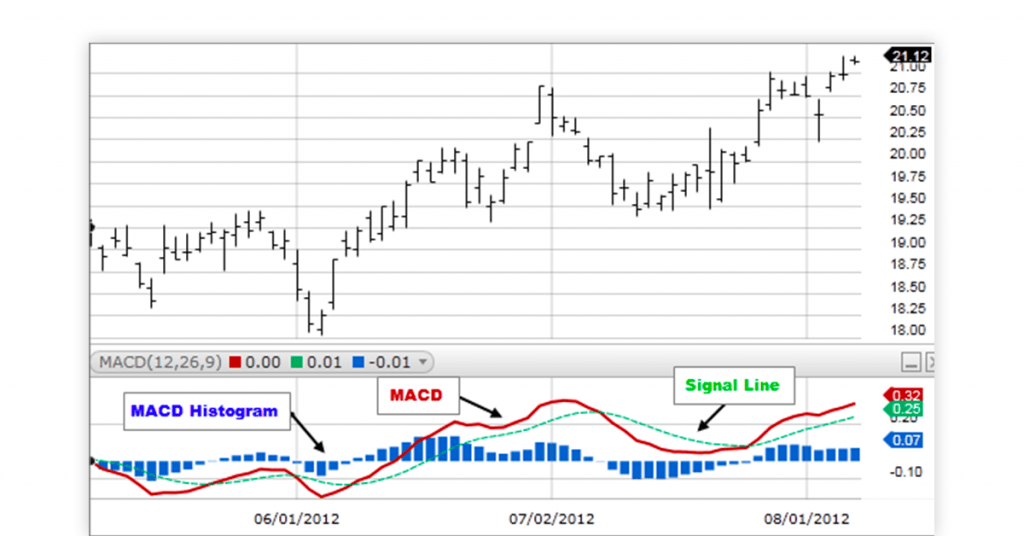
MACD is an oscillator, that is, its appearance on the chart can be visualised as two lines oscillating without being curtailed by any boundaries. It is of main use for trading trends and is sparsely used for overbought and oversold conditions.
How Does Moving Average Convergence Divergence Best Intraday Indicator for Equity Work?
In a bull market, MACD stock indicator will cross zero on more than one occasion. The market is considered to be bullish if the MACD starts to move above zero. The contrary holds true for bearish markets.
MACD: Kew Takeaways
- Helps to follow and identify the momentum of the trade
- Buy Signal: MACD line Crosses Above
- Sell Signe: MACD line Crosses below
- Might Give false positive signal in case of sideways price movement
Advance Decline Line

Also known as the A/D line, this indicator is useful for plotting the deficit or surplus between the stocks advancing and declining on a day-to-day basis. It is one of the most potent stock indicators to judge market sentiment.
How Does A/D Line Best Indicator for Intraday Trading in TradingView Work?
A/D line is one of the best stock indicators to understand the impact of stock rallying or declining. In case major indexes are rallying, and the A/D line is showing a rising trend, then it can be judged that an uptrend is happening. In case it is falling, then it can be judged that the index is approaching the end of its rally.
If the major indexes are declining and the A/D line is also declining, it can be judged that a downtrend is happening. But if the A/D line is rising, then it can be ascertained that the stock is approaching the end of its decline.
A/D Line: Key Takeaways
- Used to see market sentiment of stocks
- Not used for a particular stock but instead an Index
- Doesn’t particularly provide buy or sell signal
- Provides participation of rise or fall
- Helps to signal rise and downtrend of indices
Moving Averages

Moving averages indicator is a simple yet comprehensive trend for studying the stock market. Here the average price of any stock is obtained over a long period. The longer the time, the more accurate the average would be.
Why is Moving Averages the Best Indicator for Option Trading?
Moving averages is a customisable stock market indicator as the trader can select the number of days over which they want to calculate the average.
Once the time period is locked in, the moving averages indicator will sum up the prices of stocks for those specific days and then divide it by the total number of days.
Moving Averages: Key Takeaways
- Used to identify price trends
- Filters out short and irrelevant price movements
- Helps to determine level of support and resistance
- EMA (Exponential Moving Average) is More useful than SMA (Simple Moving Average)
- Best for swing trading
Average Directional Index
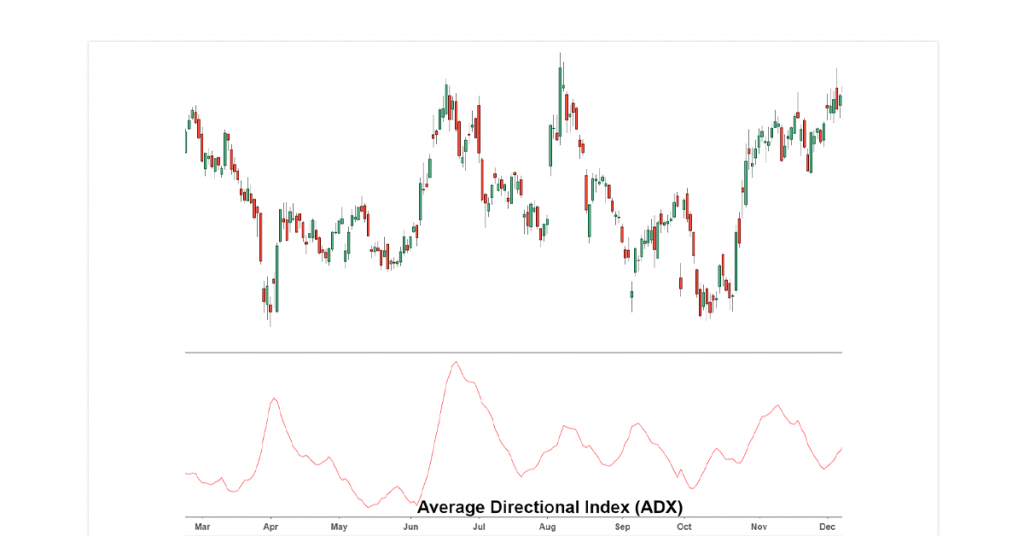
Also known as ADX, this stock market indicator is used for assessing the legitimacy of any ongoing market trend. ADX makes use of 3 lines out of which two are the negative directional indicator (-DI) and the positive directional indicator (+DI).
How Does ADX Best Intraday Indicator Setup Work?
If +DI is coming above -DI, then the price is rising. If it’s the reverse, then the price is fast falling. Further, any upcoming trend in which ADX ranks above 25, has strength. However, the same trend is weak if it ranks below 20.
ADX: Key Takeaways
- Used to identify the strength of a trade
- Use it to confirm the trade
- Doesn’t generate buy/sell signal
- ADX above 25 suggests strong Trend
- ADX below 20 suggests weak trend
Supertrend

Supertrend closely resembles MACD and Moving Averages indicators in its functioning. It makes use of the placement of prices to know the current market trends. Supertrend has two parameters- period and multiplier.
How Does Supertrend Best Intraday Indicator in Upstox Work?
For using Supertrend stock market indicator, you have to set the value of 10 for average true range and 3 as the multiplier. Also assign a particular stop loss, placing it at the green indicator line for a long position and at the red indicator line for a short position.
You can also alter the 10 and 3 values. But keep in mind that anything smaller than this will make the indicator pick more signals and noise. On the other hand, anything larger than this will eliminate the noise but reduce the signals as well.
Supertrend: Key Takeaways
- Helps to identify precise buy/sell signal
- Trend following indicator like MACD
- Buy Signal: When Supertrend closes over the closing price
- Sell Signal: When Supertrend closes below the closing price
- Beneficial when confirmed with other indicators
Stochastic Oscillator

Stochastic is known for its accuracy as it can be used to gauge which stocks were oversold and which were overbought. A pro tip from in-house trading aficionado- use stochastic oscillator along with another indicator such as RSI to further improve the efficiency.
How Does Stochastic Oscillator Best Intraday Indicator for Intraday Work?
Stochastic oscillator has been designed to follow momentum. One benefit of this approach is that momentum registers a change in direction before price. This stock analyzer consists of two lines- the K line and the D line.
When %D crosses overbought plot and %K crosses below %D, then you ought to sell. When %D remains below oversold and %K comes above %D, then it is suggested that you buy.
Stochastic Oscillator: Key Takeaways
- Helps to identify overbought/oversold stock
- Beneficial in stock
- Ranges between 0-100
- SO below 20 suggest oversold stock
- SO above 80 suggest overbought stock
Commodity Channel Index

Commodity Channel Index oscillator makes use of a momentum basis to judge whether a stock is approaching the condition of being overbought or oversold.
CCI is a useful tool for traders as it not only tells them whether they should buy or sell any stock, but also if they should refrain from a trade altogether.
How Does CCI Best Indicator for Intraday Trading Work?
CCI stock analyzer works by calculating the difference between the current price of a stock and its historical average price. If it is above zero, the price is set above the historic average and hence users may expect an uptrend. To confirm the same, CCI value should be nearing 100 or even going above it.
However, if the CCI value is below zero, users can expect a downward trend. The same can be confirmed if the CCI value is nearing -100 or below.
CCI Stock Analyzer: Key Takeaways
- Helps to determining exit and entry points in a trade
- Provide index based on historic average movement
- Helps to track the trend reversal
- Determines the near overbought and oversold signals
On Balance Volume

This stock indicator has been developed to distinguish institutional investors from retail investors. The principle is that volume tends to move the price further. And once this happens, large-scale investors will start selling and small-scale investors will start buying.
How Does On Balance Volume Best Indicator for Intraday Trading Work?
If you want to use on balance volume indicator, you need to be mindful of the following rules-
- If the current closing price is higher than yesterday’s closing price, then today’s OBV will be the sum of previous OBV and today’s volume.
- If the current closing price is lower than yesterday, then the OBV is calculated by subtracting today’s volume from the previous day OBV.
- The previous OBV is equal to the current OBV if closing prices for two consecutive days are the same.
On Balance Volume: Key Takeaways
- Helps to predict price movement by using volume changes
- Best for swing trading
- Quantitative value is irrelevant
- Best when OBV combines with Volume Bar
- Helps to identify breakout when combined with moving averages
Accumulation/Distribution Line (A/D Line)
Accumulation/distribution line (A/D line) is one of the most popular stock indicators to analyse the money flow. Along with considering the closing line, it also considers the trading range.
The analysis is based on where the stock finishes. If it finishes near the high end, this stock market indicator gives more weight to the volume.
How Does A/D Line as the Best Stock Indicator Work?
If the A/D line goes up, it indicates the buying interest. On the contrary, if the Accumulation/distribution line is going down, it shows a downtrend with negative volume.
A/D line also helps in watching the divergence. If the A/D line falls while the price rises, it indicates that the trend may reverse soon. However, if the price is falling, but the A/D line is rising, you can expect higher prices in the coming days.
A/D Line: Key Takeaways
- Helps to confirm the strength of the trend
- Doesn’t provide entry and exit point
- Rising A/D signals upward price trend
- Falling A/D signals downward price trend
- However, doesn’t factor periodical price change
Aroon Oscillator
This technical indicator for stock market analysis helps measure if the price is likely to hit highs or lows in the given period. The calculation period is 25 days.
How Does Aroon Oscillator as Stock Market Indicator Work?
There are two lines of this stock analyzer, Aroon-up line and Aroon-down line. When the Aroon-up line touches 100 while the Aroon-down line is near zero and stays in the same position for some time, you are likely to witness an uptrend. The reverse stands for the downtrend.
Aroon Oscillator: Key Takeaways
- For confirming a trend’s strength and its continuation
- Readings above 0 signal Uptrend
- Reading below 0 suggest downtrend
- Zero-line cross predict trend change
- Not the best when it comes to choppy market condition
Importance of Getting Most Accurate Intraday Trading Indicators
As I stated earlier, the stock market can be extremely volatile. Following the vital intraday trading indicators is important to establish a better understanding of the trading fundamentals. Let’s take a quick look at the importance of these trading indicators.
- Trend: Using the trend indicators, you can gain a better and more comprehensive understanding of the current trends in the stock market and in which direction the market is moving. Using various pictorial representations like charts, share values are exhibited and a trendline is formed by connecting all the points on the chart. This trendline highlights the upward or downward trend of the overall share prices.
- Volume: Volume is used for defining the total number of stocks that are sold or bought at a particular time frame. In case the volume is high for a particular timeframe, this means that the share was purchased and sold multiple times in that timeframe.
- Volatility: Volatility is used to study market unpredictability. A stock that is highly volatile indicates that there is a sudden change in the overall prices at short intervals of time. However, volatility indicator is not limited to the fall in share prices, but also the sudden rise in share prices.
- Momentum: The rate at which the stock price changes is known as momentum. It indicates the overall strength of an ongoing trend, and helps you know if there are any chances of its reversal. Moreover, bullish or bearish momentum is established based on the rate of increase or decrease in the value of the share price.
- Overlays: Overlays have multiple applications and are used by traders and stockbrokers. Rather than being displayed individually, overlay indicators are often clubbed with the price movement. Some popular overlay classifications include Bollinger Bands, Moving Averages, and Parabolic SAR.
- Oscillators: Oscillators are known for displaying their unique upward and downward movement pattern between the pre-defined upper and lower limits. Relative Strength Indicator and commodity channel index are popular examples of Oscillators.
Intraday Trading Tips for Beginners
Which Indicators are Best for Intraday Trading?
When it comes to intraday trading, every second counts. That’s why I heavily rely on indicators that offer prompt and accurate signals. Some of the best indicators for intraday trading are Moving Averages, Relative Strength Index (RSI), and Bollinger Bands.
These exceptional indicators empower traders to discern trends, detect overbought or oversold conditions, as well as foresee potential price reversals.
What Is the Best Stock Indicator?
The best stock indicator may vary depending on the trading strategy and time frame. However, one of the most widely used indicators is the Moving Average Convergence Divergence (MACD). This indicator combines moving averages with momentum analysis, helping you to identify potential buy or sell signals based on the crossover of its lines.
What Is the Best Indicator for Options Trading?
Options trading requires a unique set of indicators to assess both price movement and volatility. The Volatility Index (VIX) is one of the best intraday indicators that measures market sentiment and volatility expectations. This indicator helps to gauge potential risks and opportunities in the options market.
What Tools do Professional Stock Brokers Use?
Professional stock brokers rely on a range of tools to stay ahead in the market. They often use advanced trading platforms that offer real-time data, customizable charts, and technical analysis tools. Additionally, they can use algorithmic trading strategies and risk management tools to optimize their trading performance.
Some of the popular tools that professional stock brokers use are:
- Trading Platforms: ECG Trade, ZeroDHA, Angel One, Groww, etc.
- Financial News Platforms: Yahoo Finance, Bloomberg Terminal, CNBC, MoneyControl, etc.
- Charting and Technical Analysis Tools: Tradingview, eSignal, MetaStocks, etc.
- Risk Management Tools: eToro, WeBull, Forex.Com, etc.
- Backtesting Tools: Trend Spider, Tradingview, AmiBroker, Interactive Brokers, etc.
What are the Best Tools for Stock Trading?
To successfully navigate with stock trading, it is crucial to utilize a diverse set of technical option trading indicators such as Moving Averages, Fibonacci retracement levels, and Candlestick patterns.
These tools offer invaluable information about market trends and potential points for entering or exiting trades, as well as providing an overall understanding of market sentiment.
What are the Best Indicators for Intraday Trading?
Leading indicators are essential for intraday trading as they provide signals before a price movement occurs. Some leading indicators that you can rely on are RSI, Stochastic Oscillator, and the Average True Range (ATR). These indicators help me identify potential trend reversals and volatility spikes.
What Indicators Should I Use for Trading?
The option trading indicators you should use for trading depend on your trading style, strategy, and risk tolerance. It’s important to choose indicators that align with your goals and provide you with accurate signals.
Experiment with different indicators and find the ones that work best for you. For i.e if you’re just starting, you can use simple moving averages (SMAs), exponential moving averages (EMAs), Bollinger bands, stochastics, and on-balance volume (OBV) etc.
Conclusion
This comprehensive guide is specially curated for people about to start their stock market journey. As mentioned above, these are some of the essential intraday trading indicators that can be used for trading.
However, apart from having a basic understanding of these technical analysis and indicator for intraday trading, it is equally important to have a well-planned intraday trading strategy that will help you in mastering the basics of the stock market.
FAQs Related to Intraday Trading Indicators
Is Intraday Trading legal?
Yes, intraday trading is legal in India. However, legality is only possible through margin trading, where you are supposed to buy the stocks by paying for the actual value of shares.
Which technical indicator is the most accurate intraday indicator?
The Relative Strength Index is one of the most reliable and accurate technical indicators as it will help determine the stock market's position based on a gain or loss for the period.
What indicators do professional traders use?
Mentioned below are some of the vital indicators used by professional traders- Moving Average, Stochastic Oscillator, Exponential Moving Average, and Relative Strength Index.
Which is the no. 1 indicator for intraday?
Volatility is one of the most important indicators for intraday trading. It is used to study market unpredictability. A highly volatile stock indicates that there is a sharp change in the overall stock prices at short intervals of time.
What are the 4 types of indicators?
The 4 broad categories of indicators are- trend indicators, momentum indicators, volume indicators, and volatility indicators.
What are the best indicator for option trading in TradingView?
The best indicators for option trading in TradingView include implied volatility (IV), moving averages, Relative Strength Index (RSI), and Bollinger Bands. These indicators help assess price trends, volatility, and potential reversal points, aiding informed option trading decisions.
What are the 4 types of indicators?
The four popular types of indicators are Trend-following, Volatility indicator, Volume indicators and Oscillators.
Which is the no. 1 indicator for intraday?
There's no universally agreed upon ‘best’ indicator for intraday trading, as effectiveness varies based on strategy and market conditions. Popular intraday indicators include Moving Averages, RSI, MACD, and VWAP (Volume Weighted Average Price).
What are bank nifty best indicators?
Bank Nifty best indicators include moving averages (such as the 50 and 200-day MA), relative strength index (RSI), MACD, and Fibonacci retracements. These help gauge trends and potential reversals in the Bank Nifty index.

Written by
Mayank Dixit
![]()
Mayank Dixit is a talented content writer with an enriching educational background with Bachelor's degree in Engineering and a Master's degree in Mass Communication. With this combination of technical and creative skills, Mayank is well-equipped to produce engaging content that is informative too. He is passionate about business... Read more